Thursday, 31 March 2016

Stocks in News Today

ITC,SBIN,LUPIN.HDFC,ZEEL,INFY,JETAIRWAYS,AUROPHARMA,JUSTDIAL,TATASTEEL,BHEL,HDIL,DLF,BANKOFBARODA,VEDL,
JPASSOCIAT,KITEX,UNITECH,CYIET,
ASHOKLEY,GEOMOTOR,TVSMOTOR,BAJAJFIN

Wednesday, 30 March 2016

Nifty and Banknifty for Today Level

Nifty spot if above 7706then 7770
Nifty spot if below 7706 then 7671
Banknifty spot if above 16021 then 16280
Banknifty spot if below 16021 then 15875


Stocks In news Today

HINDZINK,LUPIN,HDFC,VEDL,TATASTEEL,NATCOPHARMA,BPCL,ONGC,MARUTI,MERCATOR,BINDALAGRO,HEROMOTOCORP,ASHOKLEY,NHPC,SUNPHARMA

Sunday, 27 March 2016

Stocks in News Today

JUST DIAL,INFY,LUPIN,HDFC,TCS,VEDL,RELIANCE,HCLTECH,NATCOPHARMA,HINDALCO,SUNPHARMA,TATSTEEL,HOCL,BSL,BALAMINES,ASHOKLEY,BAJAJFIN,

Friday, 18 March 2016

NIfty Making Hanging Man pattern on weekly chart

Nifty manages to close at 7604.35, plus by 91.5 points from previous closing on weekly basis and Nifty is on two months high. Nifty is making Hanging man patterns on weekly chart previously it was seen in weekly chart on 24.07.2015 when Hanging man  pattern was made on that week then maximum updside move was for 100 points  and then there was huge fall of around but at that time also scenario was continuing with lower top lower bottom along with Greece problem ,Gold monetization, Lower crude price.
But Now we can say that Nifty is completed this week  with Hanging man patterns that means moves significantly lower after the open, but closes above the weekly low.  And on daily chart it has closes above the Price channel that Nifty following from 30.10.2015 to 01.01.2016 that is positive sign for Nifty traders. But on Daily chart one Gap Down from 07.01.2016 range (7741-7673) not filled till now so I can assume that if Hanging man pattern on weekly basis and price channel breakout on daily basis upside movement can go in upside till 7673 to 7741 and if nifty closes continues above this level then uptrend will continue. So if you are nifty traders be cautious because this is time to wait and watch and then after confirmation  make position accordingly.


Wednesday, 16 March 2016

Candlestick patterns

                                    Single-Candle patterns:


Doji: when a open and close are almost equal. The length of the high and low can vary, . Doji means a sense of indecision (Between buyers and sellers).

Dragonfly Doji: A Doji in that the open price and close price are at the high of the day. this one normally appears at market turning points.

Gravestone Doji: A doji line that develops when the Doji is at, or very near, the low of the day.

Long-Legged Doji: long upper and lower shadows with the Doji in the middle of the day's trading range, it clearly reflects the indecision of traders.
Hammer: when price moves significantly lower after the open, but closes above the intraday low.
Hanging Man: when a security moves significantly lower after the open, but closes above the intraday low.
Inverted Hammer: A one day bullish reversal pattern. In a downtrend, the open is lower, then it trades higher, but closes near its open.
Shooting Star: This is single day pattern mostly appear in an uptrend. It opens higher, trades much higher, then closes near its open.
Short Day: A short day means a small price move from open to close, in which the length of the candle body is short.
Spinning Top: Small bodies with upper and lower shadows that exceed the length of the body. This is also indecision.

                                          Two candles patterns:

Harami: A two day pattern that has a small body day completely contained within the range of the previous body, and is the opposite color.
Harami Cross: A two day pattern similar to the Harami. The difference is that the last day is a Doji.
Bullish Harami and Bearish Harami are the two more types of Two candles patterns that is already discussed in previous blog.


                                             Bullish Reversal patterns:


Piercing Line: Bullish reversal pattern. The first day, in a downtrend, is a long black day. The next day opens at a new low, then closes above the midpoint of the body of the first day.
Morning Star: A three day bullish reversal pattern consisting of three candlesticks - a long-bodied black candle extending the current downtrend, a short middle candle that gapped down on the open, and a long-bodied white candle that gapped up on the open and closed above the midpoint of the body of the first day.
Three White Soldiers: A bullish reversal pattern consisting of three consecutive long white bodies. Each should open within the previous body and the close should be near the high of the day.
Morning Doji Star: A three day bullish reversal pattern same as to the Morning Star. first day is in a downtrend with a long black body. The next day opens lower with a Doji . The last day closes above the midpoint of the first day.
                                          Bearish Reversal patterns:

Evening Doji Star: A three day bearish reversal pattern same as the Evening Star. First day The uptrend with a large white body. The next day opens higher, trades in a small range, then closes at its open (Doji). The next day closes below the midpoint of the body of the first day.

Evening Star: A bearish reversal pattern that continues an uptrend with a long white body day followed by a gap up small body day, then a down close with the close below the midpoint of the first day.

Three Black Crows: A bearish reversal pattern consisting of three consecutive long black bodies where each day closes at or near its low and opens within the body of the previous day.
                                       Continuation Patterns:
Rising Three Methods: Bullish continuation pattern in which a long white body is followed by three small body days, each fully contained within the range of the high and low of the first day. The fifth day closes at a new high.
Falling Three Methods: Bearish continuation pattern in which a long Black body is followed by three small body days, each fully contained within the range of the high and low of the first day. The fifth day closes at a new low.


Thursday, 10 March 2016

Nifty and Bank Nifty for intraday 11 march 2013

If Nifty Spot closes above 7493 then 7539
If Nifty Closes Below 7493 then 7439
If Bank Nifty closes above 15210 then 15323
If Bank Nifty closes below 15210 then 15067

Wednesday, 9 March 2016

Nifty and Bank Nifty for intraday for 10 march 2013

Nifty spot if above 7493 then 7573
Nifty spot if below 7493 then 7458
Bank Nifty spot if above 15200 then 15412
Bank Nifty spot if below 15200 then 15093

Friday, 4 March 2016

Nifty and Bank nifty for next day

If Nifty above 7478 then 7515 and next 7540
If Nifty below 7428 then 7451 and next 7416

If Bank Nifty above 15265 then 15525 and next 15711
If Bank Nifty  below 15265 then 15079 and next 14819

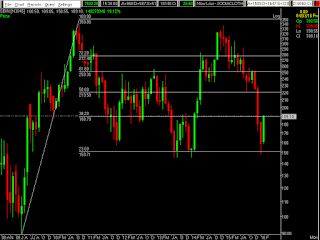
Learn how to use Fibonacci Retracement in Trading


We have taken exapmle of sbin monthly chart and i have taken retacement on monthly chart from 31-03-2009 to 30-11-2010 and then we can say that 23.6 % retracement  value is 150.71 for SBIN and so on.
Now we have seen that closing value of Sbin was next target for this month that is achieved today at 188.79.

Thursday, 3 March 2016

Nifty and Bank Nifty for Intraday

If Nifty spot sustain above 7454 then 7502 and then 7531
If Nifty spot below 7454 then 7424 then 7376
If Bank Nifty sustain above 15122 then 15244 then 15328
If Bank Nifty sustain below 15122 then 15038 then 14916

Nifty making Advance block three white soldiers pattern


The Three Advancing White Soldiers indicates a weakness in an down trend and the potential changes in to of an uptrend. so,the Advance Block has  bearish meaning and indicate possible weakness in an uptrend.
when Nifty made this pattern on 19-10-2015 then we get around 540 points in downside from there .
but the question is that today it makes again so is it again chance to gain almost same or more or less points as we get in from 19-10-2015 . same situation is repeating again.


Ads Inside Post